
How Solid Is This Read?
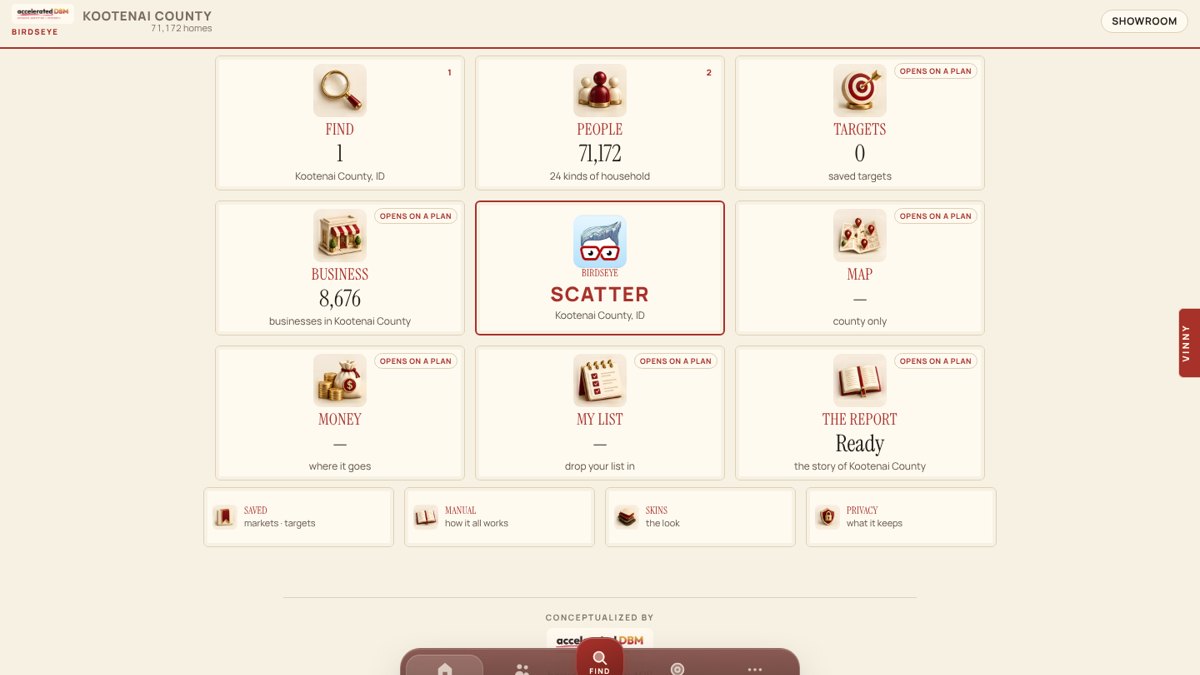
Market Narc on Birdseye, as it looks today.
The new home
Market Narc now opens like every one of our systems: Birdseye, the whole market from above. Find, People, Targets, Business, Map, Money, My List and The Report, each showing its own number. Vinny, the researcher, waits on the right edge. Type or talk.
What kinds of places are here
Gyms, churches, sit-down restaurants, fast food, bars, coffee shops, daycares, golf, pet care, salons, vets and clubs, counted per ten thousand homes and set against the whole country. The count comes from the U.S. Census. We tested a volunteer map too. It was slower and found fewer places, so we went with the federal count.
One-person businesses
How many businesses in a market are one person with no payroll, next to the ones with employees. In Kootenai County, Idaho, it is seventy-three percent. The country is seventy-eight.
Growing or shrinking
Businesses, jobs, homes and income, then and now, against the country. Kootenai County grew faster than the country on all four.
How solid is this read
Government surveys come with a margin of error, and in a small town that margin can be big. So Market Narc grades every market before it tells you anything. Kootenai County reads Solid. A small town in Montana reads Use with care, and the page says so. Small places get an honest answer, not a confident one.
What it costs us
Nothing new. Every one of these comes from free public data the government already publishes.
Scope
Market Narc migrated to the Birdseye shell and shipped data waves three through six on October 12–13, 2026, nationwide, no territories.
Wave 3: establishment density
Twelve establishment categories per 10,000 households, indexed to the U.S. (100 = national). Source: Census County Business Patterns 2023 via the market data route; households from ACS 2024 five-year. ZIPs are read through the county holding most of their land area, disclosed on the page. CBP counts employer establishments only; volunteer-run organizations are excluded, also disclosed. OpenStreetMap was benchmarked and rejected: 87-second response, two endpoint timeouts, lower recall than the census count.
Wave 4: nonemployer share
Census Nonemployer Statistics 2023 against employer establishments. Kootenai County: 16,996 nonemployer versus 6,221 employer (73%; U.S. 78%).
Wave 5: growth
Census Business Dynamics Statistics 2017 versus 2022 for firms and jobs; ACS five-year 2015–19 versus 2020–24 for households and income, each in its own period’s dollars and compared against the U.S. change.
Wave 6: reliability grade
Coefficient of variation = (margin of error / 1.645) / estimate, on households and income; the worse of the two decides. Under 12% Solid, 12–40% Use with care, over 40% Shaky.
Cost
Three fixed-host Census sources added to the existing data route under the existing key. No new key, no new spend.